
The WPI Online Date Is Live: See Startup Dates Before They're Announced (Public)
By the end of this note, you'll know how to get a probability-weighted startup forecast for U.S. data center projects — built from something no other provider tracks: weekly satellite observation of real construction progress.
This week we're rolling out the WPI Online Date inside Vulcan — the industry's first startup-date forecast built entirely on weekly observational intelligence.
**What's different about it**
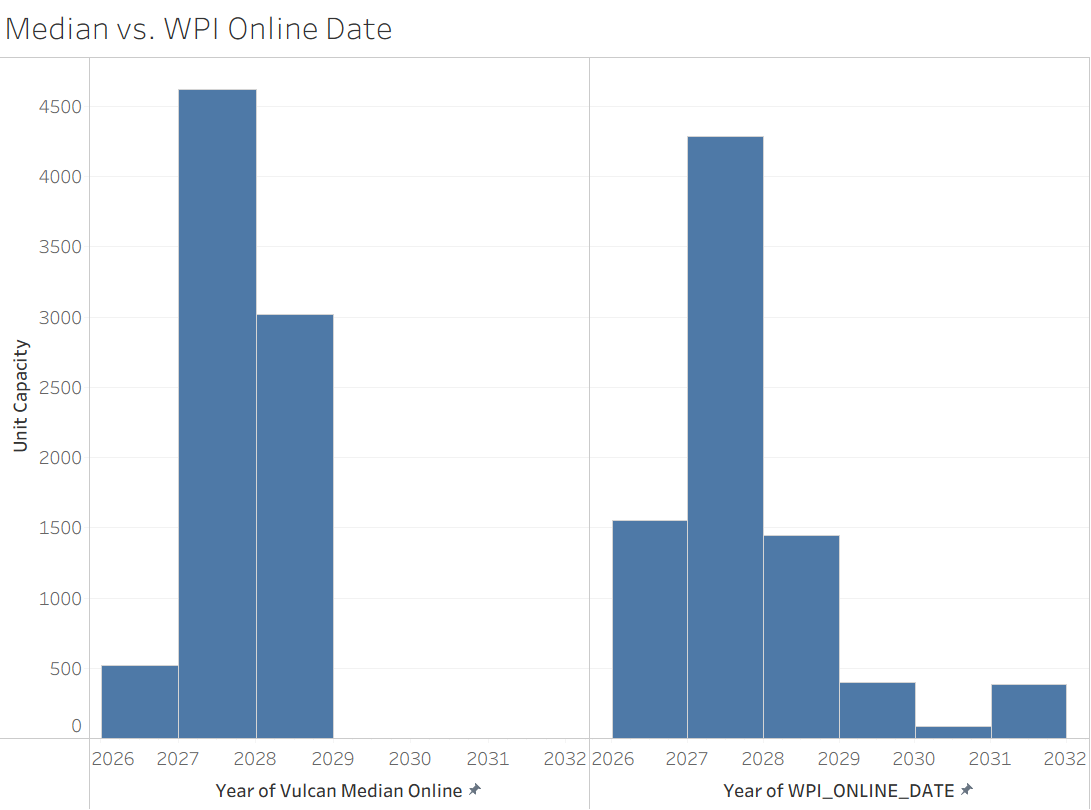
You already get our milestone online-date distribution (Earliest, Median, Latest), built from historical build-timeline data. The WPI Online Date goes a step further: it takes the weekly construction momentum we observe on the ground — via satellite, every week, on every project — and shifts your expected online date within that distribution. Instead of one static median, you get a live, moving forecast that adjusts as the project actually moves.
No other platform tracks weekly on-the-ground momentum at this scale. Median dates tell you where a project should land. The WPI Online Date tells you where it's actually heading.
**Where coverage stands today**
- ~8 GW of projects already have a live WPI Online Date
- 22+ GW of projects meet the underlying criteria (land clearing observed starting April 2025 or later) and are in the pipeline
- We expect most of those 22 GW to have WPI Online Dates within a few weeks
**Put it to work in Atlas**
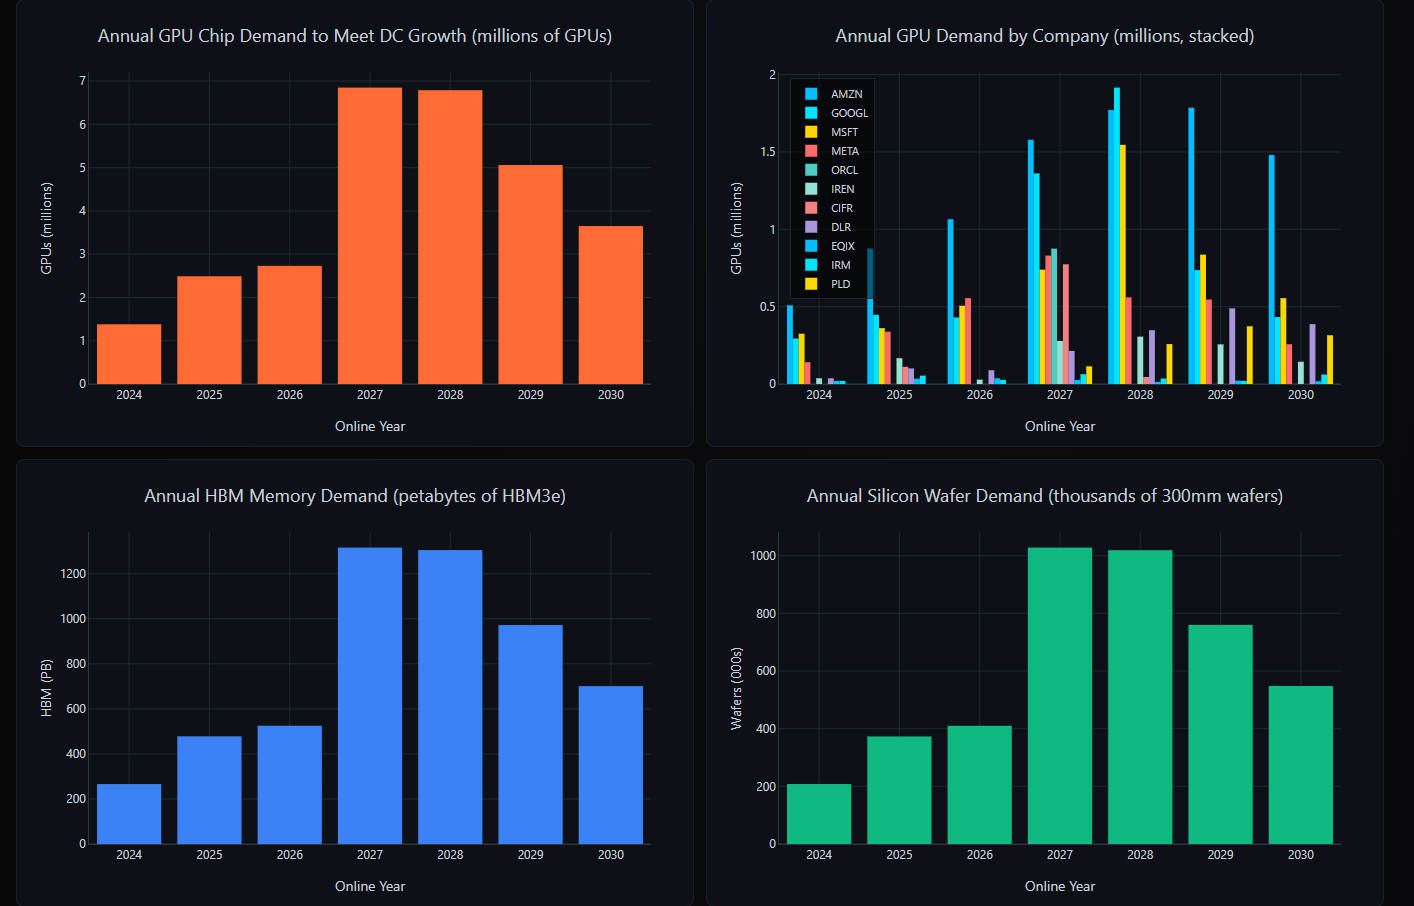
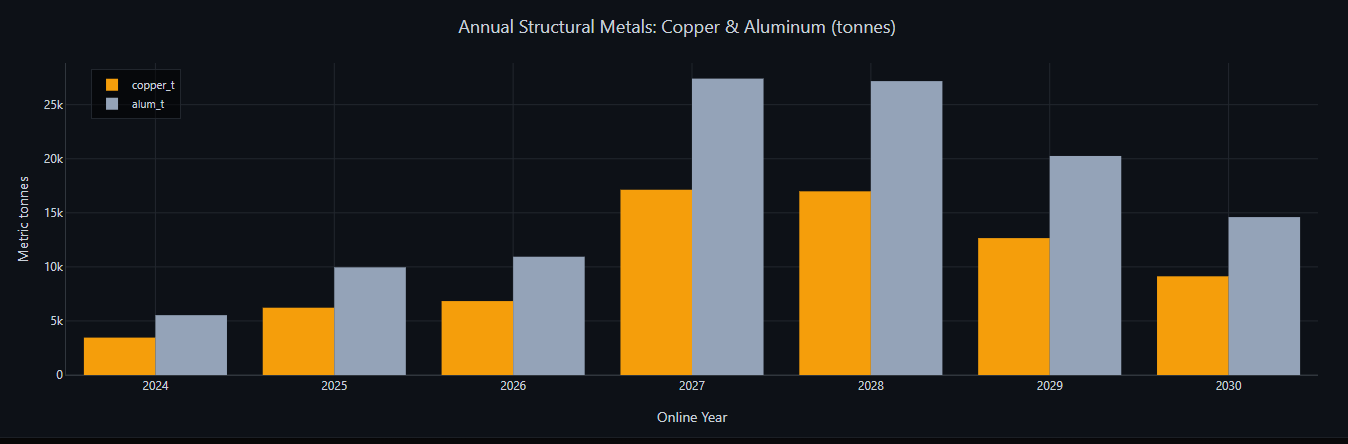
If you're a Vulcan client, you have 100 credits on Atlas, our agentic research platform — roughly 10 critical questions. One worth running if you track materials or chip equities: ask Atlas to translate our capacity outlook into projected GPU, HBM, silicon wafer, copper, and aluminum demand.
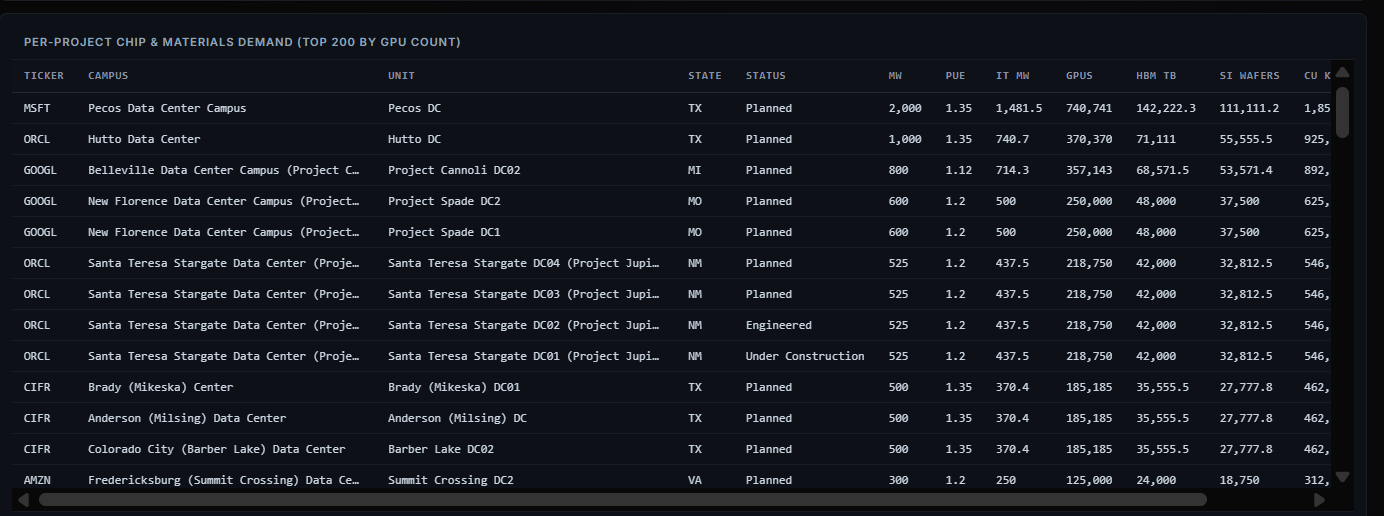
We ran this ourselves and had Atlas document its own methodology, including regional PUE adjustments (since the MW we report is total facility power, not IT load):
Methodology & Assumptions
| 1. IT power | IT_MW = Facility_MW / PUE | Nameplate is gross facility power; PUE isolates compute power |
| 2. Regional PUE | Cool 1.12 / Moderate 1.20 / Hot 1.35 | Climate-based liquid-cooled hyperscale (WA/IA cool; TX/AZ/FL hot) |
| 3. Reference GPU | NVIDIA GB200/GB300 Blackwell NVL72 | Latest-gen accelerated compute rack platform |
| 4. GPU power all-in | 2.0 kW / GPU | GPU ~1.2kW + Grace CPU + NVLink switch + NIC + storage + overhead |
| 5. GPU count | GPUs = IT_MW x 1000 / 2.0 | Power-constrained fill to IT budget |
| 6. HBM per GPU | 192 GB HBM3e (8 stacks x 24GB) | GB300 = 288GB; conservative at 192 |
| 7. HBM dies | 64 DRAM dies / GPU (8-Hi) | 12-Hi = 96 dies/GPU |
| 8. Silicon / GPU | ~10,500 mm2 (logic+HBM+interposer) | ~0.15 of a 300mm wafer per GPU |
| 9. Copper / GPU | 2.5 kg | Power delivery, busbars, NVLink copper backplane, cold plates |
| 10. Aluminum / GPU | 4.0 kg | Heatsinks, chassis, rack structure |
| 11. Gold / GPU | 0.5 g | Connectors, wire bonding, plating |
It's a sledgehammer model on purpose — every assumption is exposed and tunable just by telling Atlas to change it. And because it's built project-by-project, you can drill into any single asset to see exactly what's driving the demand number, not just the aggregate. That level of traceable, adjustable, project-level modeling isn't something a static report or spreadsheet can give you — it's only possible because Atlas sits directly on top of live Vulcan data.
If you're already a Vulcan client, your Atlas credits are live now — go ask it something - agents.synmax.com
**If you're not yet a Vulcan client:**
This is the piece most forecasts can't offer you: a startup date forecast grounded in weekly, independently observed construction activity, not a static build-timeline average — plus an agentic platform that can turn that same data into a materials and equipment demand curve on demand, project by project. No comparable solution combines verified weekly satellite tracking with an agent that can be re-tasked in plain English to answer the next question. If dates, capacity, and downstream demand for power and data center buildouts affect how you invest, trade, or plan, this is built for exactly that.
Reach out to David Bellman at Dbellman@synmax.com to see the WPI Online Date and Atlas live on the projects you care about.
